FirstSection
Data, Research, and Technology simplified
Empowering Data Users and Data Owners
postSection
CloudQuant News
CloudQuant News
Delivering Client-Specific Data at Scale
CloudQuant announces new whitepaper featuring Deception & Truth datasets
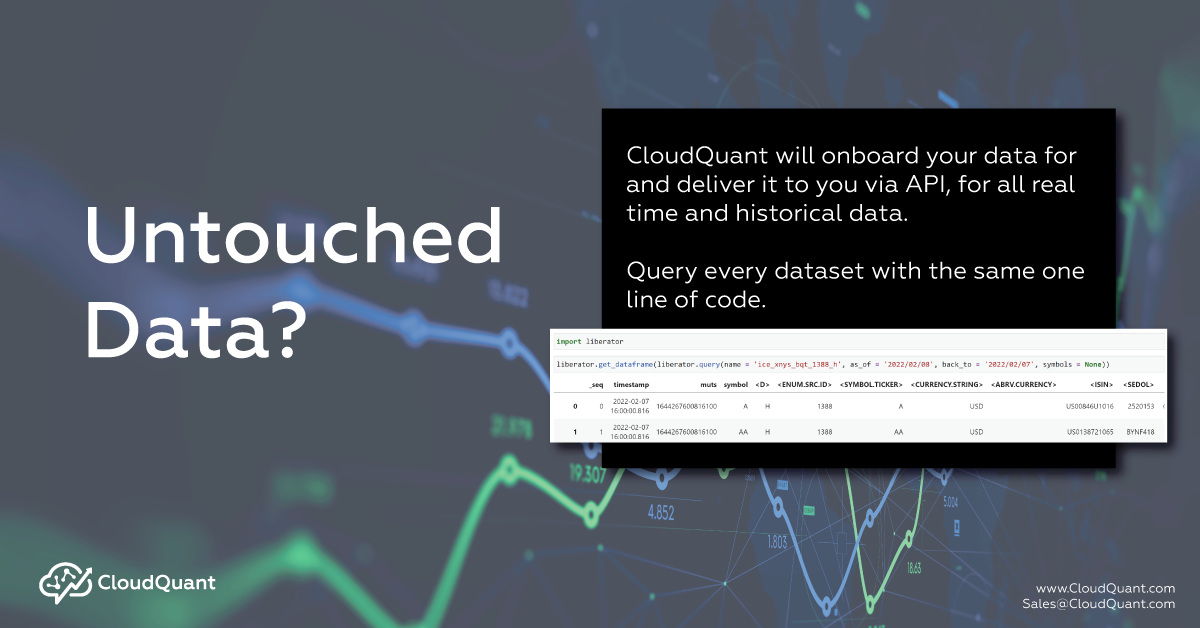
Untouched data? Let CloudQuant Help
SecondSection
A single source for
Alternative Data, Data Technology, Data Research, And Consulting
CloudQuant is a Commercial Data, Research, and Technology Company serving global financial services and corporate clients.
Find valuable data sources for your business to measure what you care about today, to predict tomorrow.
Integrate thousands of datasets in minutes to empower your data scientists, management consultants, investment researchers, executives, and engineers.
Access high-value datasets through one simple data fabric and full data tech stack.
Discover the signal in the noise by leveraging our data research expertise.
Dataset Catalog
For Data Consumers
Technology
Liberator API, MS Excel™,
CQ AI (Jupyter Lab)
Data Showcasing
Vendor Services
Data Intelligence
Research Tools, White Papers, Data Analysis, Data Scouting Services
ThirdSection
One Contract. One Line Of Code.
Thousands Of Datasets.

- Historical Point-In-Time Data
- Live Streaming Data
- C++, Python, R, C#, Javascript, MS Excel™

- A private Hosted Python+R Jupyter Labs environment
- Access to all permissioned Liberator datasets
- Algorithmic access to our Mariner backtesting system

- Powerful high resolution strategy backtesting
- White papers with corresponding CloudQuant source code
- Write sophisticated algorithmic trading strategies in Python
- Replay years of US equities trading utilizing high resolution tick-level data

- Visualizing quantitative data powers the engine of systematic innovation
- Powerful Alternative data & trading signal visualization tool provides industry professionals to rapidly browse hundreds of datasets.
FourthSection
Our Partners
Trusted By Global Thought Leaders













FifthSection
Testimonials
See what our customers say about cloudQuant
Weihong Zhang,
CEO of Cmind
Moving fast is the biggest competitive advantage in today's business world. The CloudQuant Team did just that. Within a few days of engagement with CloudQuant, we have moved lightning fast in onboarding, marketing, and selling our datasets.David Taylor,
Co-President and Chief Technology Officer of Exegy
Our partnership with CloudQuant advances our efforts to make state-of-the-art trading technology and predictive data more accessible and affordable for a broad range of market participants.Francesco Cricchio,
CEO of BRAIN
CloudQuant’s robust infrastructure consistently speeds up the testing time of Brain alternative datasets to potential clients.Landon Swan,
Founder of LikeFolio
CloudQuant was able to analyze our data and build a strong whitepaper and use-case, benefiting both us and our clients.Tomas Diago,
CEO and Founder of Danel Capital
I am very impressed with the capabilities of the CloudQuant team and technology and I think the white paper they produced covers everything I wanted to know about my dataset.
Erez Katz,
CEO and Co-Founder of Lucena Research / Neuravest
You are saving us months of work…
Craig Iseli,
COO of SpiderRock Holdings
Partnering with CloudQuant for technology has allowed us to move forward much faster than we could have otherwise.


