FirstSection
postSection
CloudQuant News
Delivering Client-Specific Data at Scale
By Marli Welch
/ March 25, 2024
CloudQuant is releasing a powerful data delivery service that your firm can use to deliver Client-Specific Data at scale. The...
Read More
CloudQuant announces new whitepaper featuring Deception & Truth datasets
By Marli Welch
/ February 15, 2024
CloudQuant's New Whitepaper, "Outperforming The Market With Measures Of Deceptive And Truthful Language In Regulatory Filings," Reveals How Deception &...
Read More
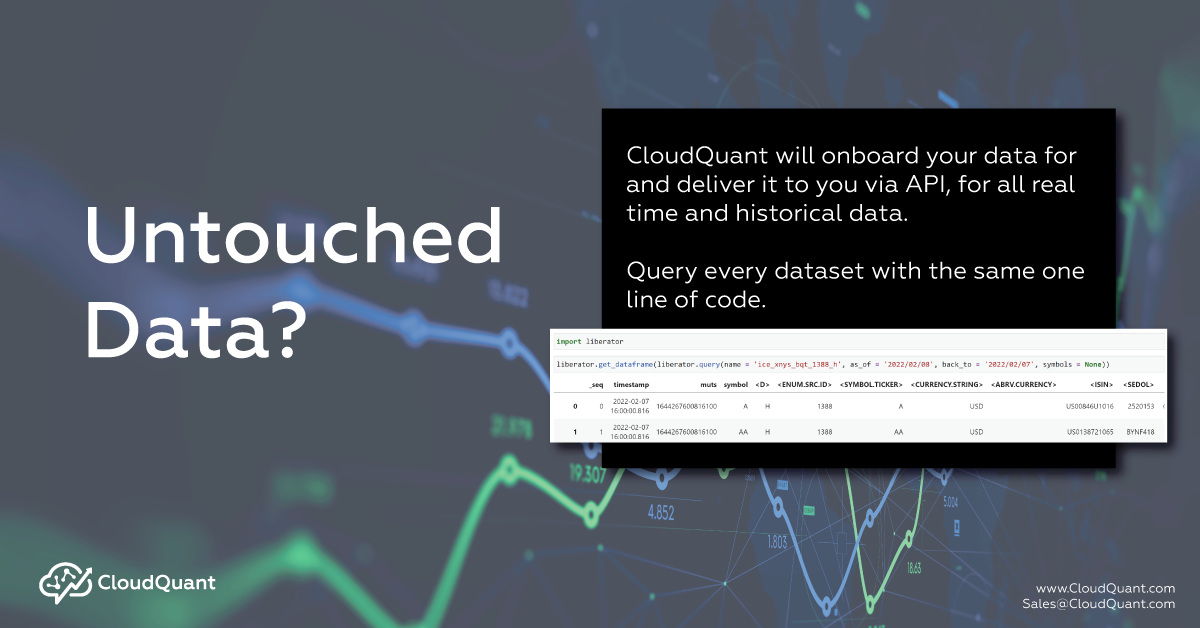
Untouched data? Let CloudQuant Help
By Marli Welch
/ October 3, 2023
Leverage your untouched datasets with the help of CloudQuant Every year, an astonishing number of datasets remain untouched, hidden away...
Read More
SecondSection
ThirdSection


FourthSection